Fiscal Cliff

Users who are viewing this thread

Status
Not open for further replies.

Stone

Well-Known Member
Messages
5,186
Reaction score
54
Tokenz
0.00z
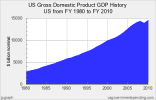
Just to add to this here is a chart showing GDP increasing 5 fold{roughly} since 1980

_11853.3_12623_13377.2_14028.7_14369.1_13939_14508.png
..........................................


But not that rate of increase since 2008. And that is on your graph.
And this is why your associations are incorrect.
You directly compare the current financially distressed conditions of the government to economies without this extreme distress...... ignoring the disparity of ability to collect needed revenue. Your argument is a fallacy ( :D )
The Wikipedia graph clearly shows the association between declining revenues and increased debt load since 2008.


CBO_-_Revenues_and_Outlays_as_percent_GDP.png
 
  • 40
    Replies
  • 597
    Views
  • 0
    Participant count
    Participants list

Stone

Well-Known Member
Messages
5,186
Reaction score
54
Tokenz
0.00z
..................
Whats the solution?............................

I just cant approve of any tax hike unless the are injected back into the economy with one thing in mind jobs...Jobs Which cycle back to cause other jobs in the private industry.

Just pointing out that you did argue to raise taxes on the largest segment of the population.....middle class consumers while cutting taxes on the very wealthy....with your regressive fixed rate sales tax plan you described as 'fair'.


So you do approve of a tax hike...... and as far as jobs.....the more you tax the consumer, the less he has to spend, the less consumer demand exists, the less the rationale for increased production, the less the need for creating new jobs.
But then, this was explained to you before and you presented a convoluted Marxist solution----->essentially, somehow the government should create jobs and everything would be Rosy ( ironic----->the Obama solution )


tax hike unless the are injected back into the economy
There it is again......tax the middle class more so they, the consumer base, will somehow create their own jobs crazy.gif
 
Last edited by a moderator:

Stone

Well-Known Member
Messages
5,186
Reaction score
54
Tokenz
0.00z
........................
Lowering them on the rich will provide some relief /prices lower somewhat but the results are slower and not as pro profound maybe hire an extra guy..same may choose to expand..raising them will cause the opposite................................

As this hasn't happened to any significant degree under the Bush cuts since 2008, with wealth accumulation at record rates and record amounts since the economic melt down , what justification do you have to associate lowering taxes further on the wealthy ...to improving current job creation .....while you argue at the same time to tax the consumer base more, leaving them with less to spend?

TM.....that makes no sense.
 

Stone

Well-Known Member
Messages
5,186
Reaction score
54
Tokenz
0.00z
Again I've gotten this message when trying to rate a thread.
And I will point this out to administration because I have not voted to rate this thread in the past.


Stone

Well-Known Member
Messages
5,186
Reaction score
54
Tokenz
0.00z
Here's a new report showing that the majority those of wealth do not agree with current tea party/libertarian/neo-conservative/right wing extremists in Congress.

While the wealthy don't like tax hikes and are worried about them......here is their reasoning:

http://finance.yahoo.com/news/majority-rich-want-themselves-taxed-193437266.html

Titled: Majority of Rich Want Themselves Taxed More: Poll

excerpt>
Nearly three quarters of them are "extremely or very concerned about their taxes going up." Other recent surveys show that the wealthy support higher taxes as part of a balanced solution to the government debt problem that includes spending cuts.


Edit: a position I support.
 
Last edited by a moderator:

Accountable

Well-Known Member
Messages
6,962
Reaction score
1
Tokenz
0.00z
If Washington would look to their own jobs and trust the market to take care of itself, then they would do a better job of the jobs they're assigned and the market would take care of itself. It's all the meddling and temporary measures that's fucked everything up, imo.

The federal gov't could do all that they are constitutionally charged to do with a small fraction of the revenue they take in, but that doesn't matter in today's nanny-state world.

Any predictions on when Washington will extend the deadlines? I say they'll posture until about mid January, then make retroactive law (meaning ex post facto, which is strictly unconstitutional but who gives a shit, right?)

So my pick for the pool is late night Friday January 18, to try & stay out of the media spotlight.
 

Natasha

La entrepierna de fuego
Valued Contributor
Messages
38,297
Reaction score
246
Tokenz
2,042.17z
Again I've gotten this message when trying to rate a thread.
And I will point this out to administration because I have not voted to rate this thread in the past.


Posting it here does not count as reporting it to the staff. You can either report your own post to bring their attention to it OR you can put it in the feedback forum. They're not going to find it here except by random happenstance.
 

Stone

Well-Known Member
Messages
5,186
Reaction score
54
Tokenz
0.00z
Posting it here does not count as reporting it to the staff. You can either report your own post to bring their attention to it OR you can put it in the feedback forum. They're not going to find it here except by random happenstance.
Thanks....but.... I reported my own post just after making it.
 

The Man

Valued Contributor
Valued Contributor
Messages
11,798
Reaction score
623
Tokenz
176.84z
Indeed. And the Wikipedia graph showing the decline in revenues and an increase in debt load clearly demonstrates the seriousness of the financial condition of our government.

A decline in percentage of GDP is not a decline in revenues...It is only a decline in relation to the percentage of GDP.
As I said earlier if the FED govt gained 3 trillion {random number} in revenues that 3 trillion could be 20,30 or 40percent of the GDP makes no difference it would still be 3 trillion.
The debt load is due to excessive spending Stone..its evident by your chart..spending{percent of GDP} is at record highs...This is what causes the light blue line down to be farther away.
Something else you should notice about your chart...it does not show a reduction in spending{for the next few years} that we are being told will happen...But rather hold record high spending in relation to GDP.
Also if you look at your chart again it also shows revenues going up in relation to GDP...2013 is less than a week away,it shows a climb for 2011 and 2012.
 
Last edited by a moderator:

The Man

Valued Contributor
Valued Contributor
Messages
11,798
Reaction score
623
Tokenz
176.84z
But not that rate of increase since 2008. And that is on your graph.
And this is why your associations are incorrect.
You directly compare the current financially distressed conditions of the government to economies without this extreme distress...... ignoring the disparity of ability to collect needed revenue. Your argument is a fallacy ( :D )
The Wikipedia graph clearly shows the association between declining revenues and increased debt load since 2008.


CBO_-_Revenues_and_Outlays_as_percent_GDP.png
My chart was to show that the GDP has a pretty steep ramp stone..Thus almost always going up..the same increase doesnt have to have happened since 2008...that was during the crash...its is already back on the rise again showing signs of economic health ..GDP is just a tool to examine the economy.
When you look at your graph it also already shows revenues back on the rise in relation to GDP

Also you are misusing its application.
For example if GDP increased two fold {and govt revenues stayed the same} the govt would still have the same revenues ...but these would make up a smaller percentage{half} of the GDP...so they use this percentage to have the public perceive they have reduced revenues.
 

The Man

Valued Contributor
Valued Contributor
Messages
11,798
Reaction score
623
Tokenz
176.84z
Just pointing out that you did argue to raise taxes on the largest segment of the population.....middle class consumers while cutting taxes on the very wealthy....with your regressive fixed rate sales tax plan you described as 'fair'.


So you do approve of a tax hike...... and as far as jobs.....the more you tax the consumer, the less he has to spend, the less consumer demand exists, the less the rationale for increased production, the less the need for creating new jobs.
But then, this was explained to you before and you presented a convoluted Marxist solution----->essentially, somehow the government should create jobs and everything would be Rosy ( ironic----->the Obama solution )


There it is again......tax the middle class more so they, the consumer base, will somehow create their own jobs crazy.gif
You seem pretty confused...that was a presentation and was expressed as such.
But as AA said we should stick to topic...I agree...No need in this thread getting trashed as well
 

The Man

Valued Contributor
Valued Contributor
Messages
11,798
Reaction score
623
Tokenz
176.84z
As this hasn't happened to any significant degree under the Bush cuts since 2008, with wealth accumulation at record rates and record amounts since the economic melt down , what justification do you have to associate lowering taxes further on the wealthy ...to improving current job creation .....while you argue at the same time to tax the consumer base more, leaving them with less to spend?

TM.....that makes no sense.

I didnt say to lower em on the rich in the post quoted...I was showing what generally happened if they are lowered.

Also wealth inequality already leveled off stone

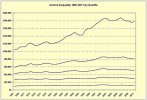
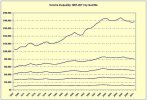
income_inequality.jpg


But anyway...isnt much more to say.
I dont trust the govt to reduce spending to deliver as promised
You appear to.
 
Last edited by a moderator:

Stone

Well-Known Member
Messages
5,186
Reaction score
54
Tokenz
0.00z
A decline in percentage of GDP is not a decline in revenues...It is only a decline in relation to the percentage of GDP.
As I said earlier if the FED govt gained 3 trillion {random number} in revenues that 3 trillion could be 20,30 or 40percent of the GDP makes no difference it would still be 3 trillion.
The debt load is due to excessive spending Stone..its evident by your chart..spending{percent of GDP} is at record highs...This is what cause the light blue down to be farther away.
Something else you should notice about your chart...it does not show a reduction in spend{for the next few years} that we are being told will happen...But rather hold record high spending in relation to GDP.
Also if you look at your chart again it also shows revenues going up in relation to GDP...2012 is less than a week away,it shows a climb for 2011 and 2012.


You are confused and using the terminology incorrectly.

As I said earlier if ...
Your 'if' is irrelevant....the issues at hand are economic realities not the irrational analogies you fabricate, TM.

The debt load is due to excessive spending Stone..its evident by your chart..spending{percent of GDP} is at record highs...This is what cause the light blue down to be farther away.
Indeed.....spending increases were massive and there was a decline in revenues....all in relation to % GDP.
Your context simply isn't appropriate for comparisons.


Also if you look at your chart again it also shows revenues going up in relation to GDP...2012 is less than a week away,it shows a climb for 2011 and 2012.
But not at the claimed 5 fold rate you claimed.....that's the point I called you out on.
That 5 fold rate only applies up to 2008. From 2008 the slope from 2008 to now is flat.

Watch Accountable's Ted video.....there is a lot there you need to learn and understand.
 

Stone

Well-Known Member
Messages
5,186
Reaction score
54
Tokenz
0.00z
My chart was to show that the GDP has a pretty steep ramp stone..Thus almost always going up..the same increase doesnt have to have happened since 2008...that was during the crash...its is already back on the rise again showing signs of economic health ..GDP is just a tool to examine the economy.
When you look at your graph it also already shows revenues back on the rise in relation to GDP

Also you are misusing its application.
For example if GDP increased two fold {and govt revenues stayed the same} the govt would still have the same revenues ...but these would make up a smaller percentage{half} of the GDP...so they use this percentage to have the public perceive they have reduced revenues.


My chart was to show that the GDP has a pretty steep ramp stone.
You are repeating yourself.
The slope of your graph since 2008 averages to a flat line with no increase.


Thus almost always going up
No...it doesn't and it's obvious.
The GPD deviated sharply in 2008.
Graphs are averages over time and the average between 2008 and 2010 on your graph is a flat horizontal line.


Also you are misusing its application.
For example if GDP increased two fold {and govt revenues stayed the same} the govt would still have the same revenues ...but these would make up a smaller percentage{half} of the GDP...so they use this percentage to have the public perceive they have reduced revenues.
You do not understand the term GDP......it stands for Gross Domestic Product.
For it to go up two fold from one year to the next would be an economic boom of unrepresented proportions this nation has probably never seen since the Great Depression. That would be the doubling of an economy.
Not going to happen.

TM....economics are discussed and compared by referring to revenue spending and revenue collection ...associated with the GPD......not your biased fudging.
http://en.wikipedia.org/wiki/Gdp
You can read it or not.....but your argument does not change the accepted relationships for comparing economies.
Your analogies are comparable to 'garbage in garbage out'.
 

Stone

Well-Known Member
Messages
5,186
Reaction score
54
Tokenz
0.00z
You seem pretty confused...that was a presentation and was expressed as such.
But as AA said we should stick to topic...I agree...No need in this thread getting trashed as well

You did argue for a tax hike on the middle class and you did argue for a tax reduction on the very wealthy.
You called it a 'fair tax'....but as you were shown, your flat sales tax was a regressive tax.
You posted it at this site and it is an economic argument.
 

Accountable

Well-Known Member
Messages
6,962
Reaction score
1
Tokenz
0.00z
Do y'all do this on the religious forums? You do, don't you?

I'm out. Somebody PM me if by some miracle these two yahoos get back on track.


.......... why the fuck did I say "back"?
 

Stone

Well-Known Member
Messages
5,186
Reaction score
54
Tokenz
0.00z
I didnt say to lower em on the rich in the post quoted...I was showing what generally happened if they are lowered.

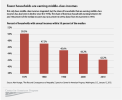
Also wealth inequality already leveled off stone

income_inequality.jpg


But anyway...isnt much more to say.
I dont trust the govt to reduce spending to deliver as promised
You appear to.

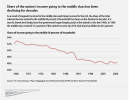
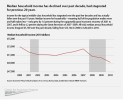
Your chart only covers the middle class......


Stats from Wikipedia...
http://en.wikipedia.org/wiki/Wealth_inequality_in_the_United_States

In 2007 the richest 1% of the American population owned 34.6% of the country's total wealth

However, after the Great Recession which started in 2007, the share of total wealth owned by the top 1% of the population grew from 34.6% to 37.1%

Thus, the top 20% of Americans owned 85% of the country's wealth and the bottom 80% of the population owned 15%.

Financial inequality was greater than inequality in total wealth, with the top 1% of the population owning 42.7%, the next 19% of Americans owning 50.3%, and the bottom 80% owning 7%


However, after the Great Recession which started in 2007, the share of total wealth owned by the top 1% of the population grew from 34.6% to 37.1%,

that owned by the top 20% of Americans grew from 85% to 87.7%.


The Great Recession also caused a drop of 36.1% in median household wealth but a drop of only 11.1% for the top 1%, further widening the gap between the 1% and the 99%.


According to the Congressional Budget Office, between 1979 and 2007 incomes of the top 1% of Americans grew by an average of 275%


According to US economist Joseph Stiglitz the richest 1% of Americans gained 93% of the additional income created in 2010.


From another source:
http://money.usnews.com/money/perso...ecline-of-the-middle-class-behind-the-numbers

excerpt>

According to an August 2012 Pew Research Center report, only half of American households are middle-income, down from 61 percent in the 1970s. In addition, median middle-class income decreased by 5 percent in the last decade, while total wealth dropped 28 percent.


According to the Economic Policy Institute, households in the wealthiest 1 percent of the U.S. population now have 288 times the amount of wealth of the average middle-class American family.


Your analysis of that simple and limited graph you posted is a joke.


And you have argued to lower taxes on the wealthy and raise them on the middle class.......you called it a 'fair' tax.
 

Stone

Well-Known Member
Messages
5,186
Reaction score
54
Tokenz
0.00z
Do y'all do this on the religious forums? You do, don't you?

I'm out. Somebody PM me if by some miracle these two yahoos get back on track.


.......... why the fuck did I say "back"?

You posted a thread on the economic fiscal cliff approaching. What did you expect discussed if it wasn't about the economy and taxes?
 
Status
Not open for further replies.
78,874Threads
2,185,387Messages
4,959Members
Back
Top